Graphing nodes
There is an utility that allows you to graph a network of all nodes, plus any topics that connect them. It was inspired by rqt_graph on ROS, minus the nice colors and interactivity. The file drawmap.py contains said utility. To use it:
- Ensure that you have the
graphvizPython module installed. - Run the master node and any other nodes, as usual.
- When all nodes are up and running, execute
drawmap.py(python drawmap.pyor similar). - The script should generate and create a PNG image with a map of any nodes and the topics that connect them.
If you don’t see the image, it should be on the same folder, under the name
temp.gv.png. The filetemp.gvis the DOT source which generated the image, should you want it.
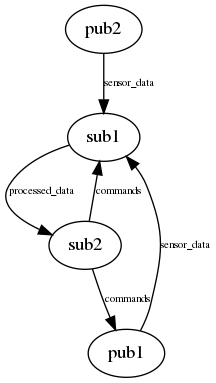
See below for an example diagram. pub1 and pub2 both generate sensor data and send it to sub1. sub1
processes it and publishes the processed data, which is received by sub2. sub2 monitors the processed data and,
if a certain condition is met, will command both pub1 and sub1 to stop their activities, but not pub2.